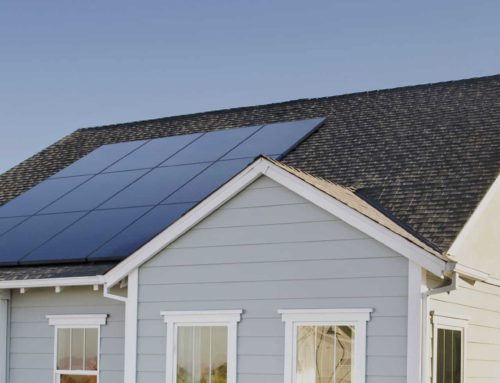
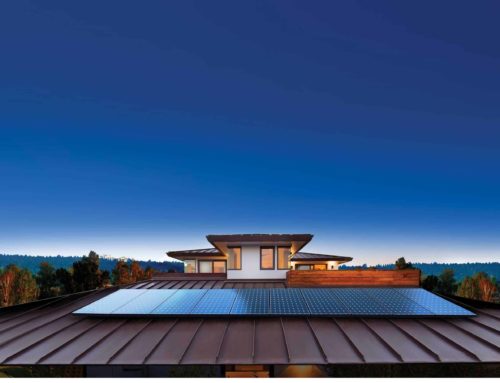
In our 4th blog in this series, we are going to talk about how your new solar panels affect your bottom line, and how you can use averages in order to understand power usage in your buildings. Let’s start with how your panels work.
When photons of light excite electrons in one layer of a panel’s surface, electricity is created. That electricity is then diverted through conductive layers and wired into your home, replacing energy you would have had to buy from the electric company. Solar energy can be used to power any appliance or device as long as it is not powered by natural gas or another resource.
Each solar panel is rated to put out a certain number of watts. Nowadays, the average peak power output of a solar panel is around 340 watts. This means that an average home requires about 18 panels in order to generate the proper number of kilowatts needed to power a home. This would give a home about 6 kW (or 6000 watts) of power to be distributed before taking power from the grid.
Super simple, right?
The only thing about solar power that can get a little confusing, is that we are working with the sun. That means we have to understand that the sun rises and sets, and therefore panels will not always be producing the amount of power that they are capable of. This is caused by the different angles that the sun shines on your panels throughout the day. So, in our example above, a 6 kW solar panel system can produce that much power under “full” sun, but the sun is technically only “full” during midday. <Solar company> has solved this problem by basing their math on something the industry calls Peak Sun Hours.
SunPower by PGT Solar looks at all the sunshine in a given location over an entire year, cross- references with the current technology outputs, and then divides it by 365 days. The number they come up with is the average number of hours the sun would have to make the energy required for a home or business.
So, if you live in an area with an average of 5 peak sun hours per day, then the 18-panel system (6 kW) that we’ve been using as an example would be expected to generate about 30 kWh of electricity on an average day. This would end up at around 10,950 kWh per year (365 times 30 kWh/day).
If, in a given year, you used 12,000 kWh of electricity, then your solar panels would cover 10,950 kWh, leaving you only fiscally liable for 1050 kWh of power you’d have to get from the grid.
Financially, if the utility company were charging 12.22 cents per kilowatt hour, your power bill would be around $1466.40 per year — with solar panels, that same year would only cost you $128.31 to power your entire home. That’s an enormous amount of savings!
So, once you know these rates and can understand how you might save with solar panels, how can you make an educated guess as to how much power you’ll need? The answer is simple: you average it.
Averages are a powerful mathematical tool when used properly. With power, averages can really help determine and compare the amount of kW that a building uses when certain devices are on or off. For example, when everything is turned on in your home, your home uses 50 kilowatts (kW) of power. When everything is off, your home uses 0 kW of power. So, on average, your home uses 25 kW of power.
Why is this useful to you?
Well, first of all, when considering the days of the week (when fewer people are home) you may use less average power than on the weekends. Being able to compare these two amounts can allow you to determine what devices are used when (and in what amounts,) allowing you to better regulate your appliances, tools, thermostats, and other electronics.
Items that use power are often referred to as power ‘load,’ or power ‘demand.’ These two terms are often used when discussing the average power consumption of a building. So, if a person describes a building as having an average daily load of 50 kW, that means that the building uses 50 kW of electricity every day.
Average power gets tricky if you don’t compare equal amounts of time. For example, some months have 28 days, and some months have 31. So, comparing the two months might have a lot of variance in the average. In this case, it would be better to break down the comparison into daily or weekly averages.
Average Power calculations are simple too. It’s fairly easy to look at a building’s full power load for 15 minutes, then multiply it out by 4 in order to determine what a full average load would be for an hour. From there, you can calculate days, or weeks as you see fit. After you learn the average power calculations, you can determine the best practices you can make when working within your utility budget.


